Dashboard Overview
The SwiftPatch dashboard is your command center for managing apps, shipping releases, tracking adoption, and collaborating with your team.
Sign in at app.swiftpatch.io to get started.
In the dashboard, your organization is called a workspace.
Home Screen
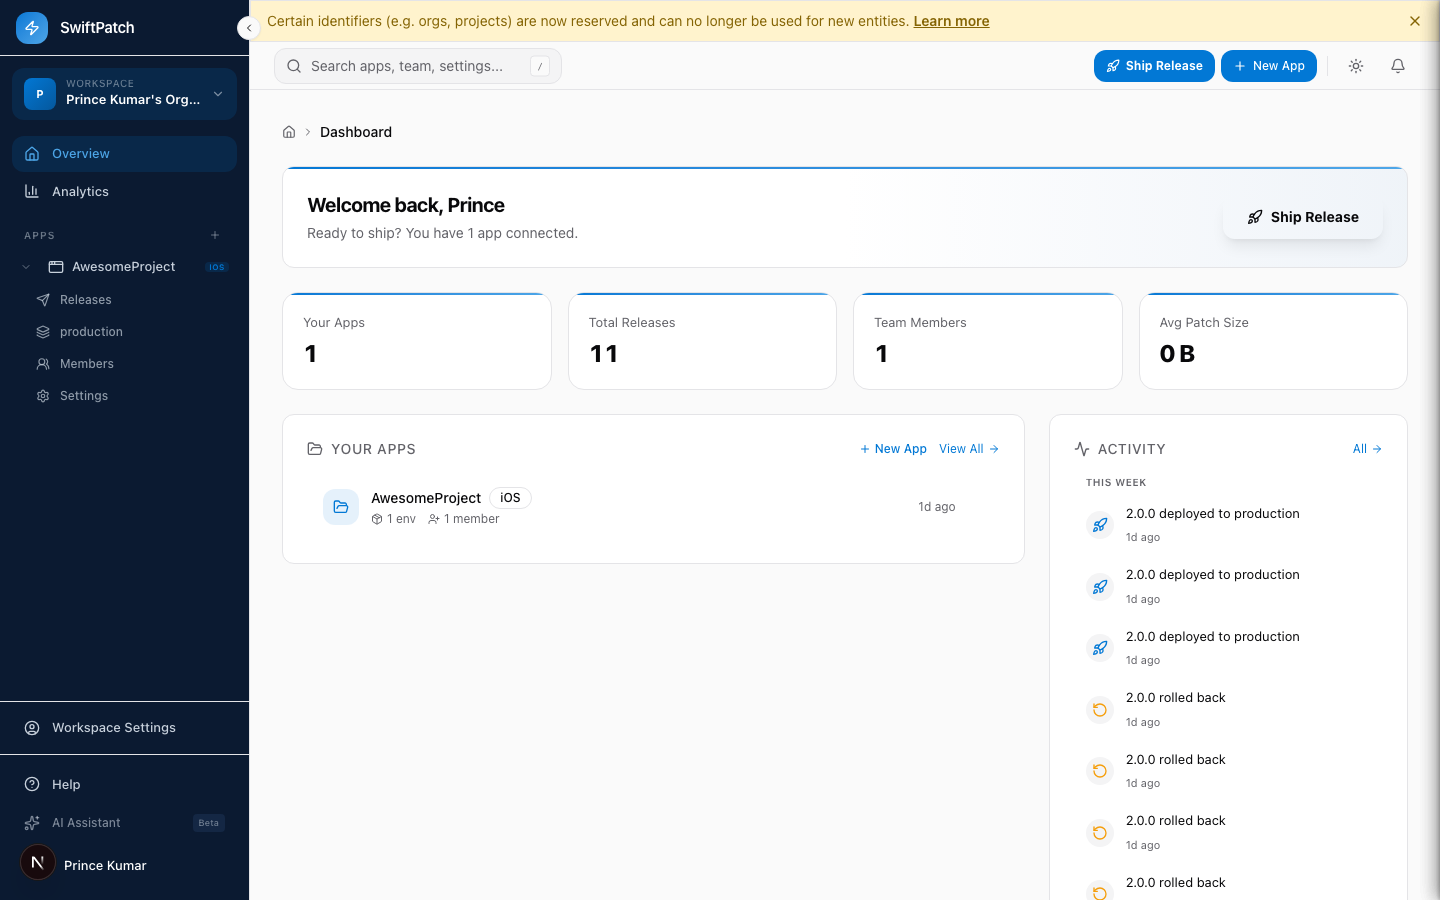
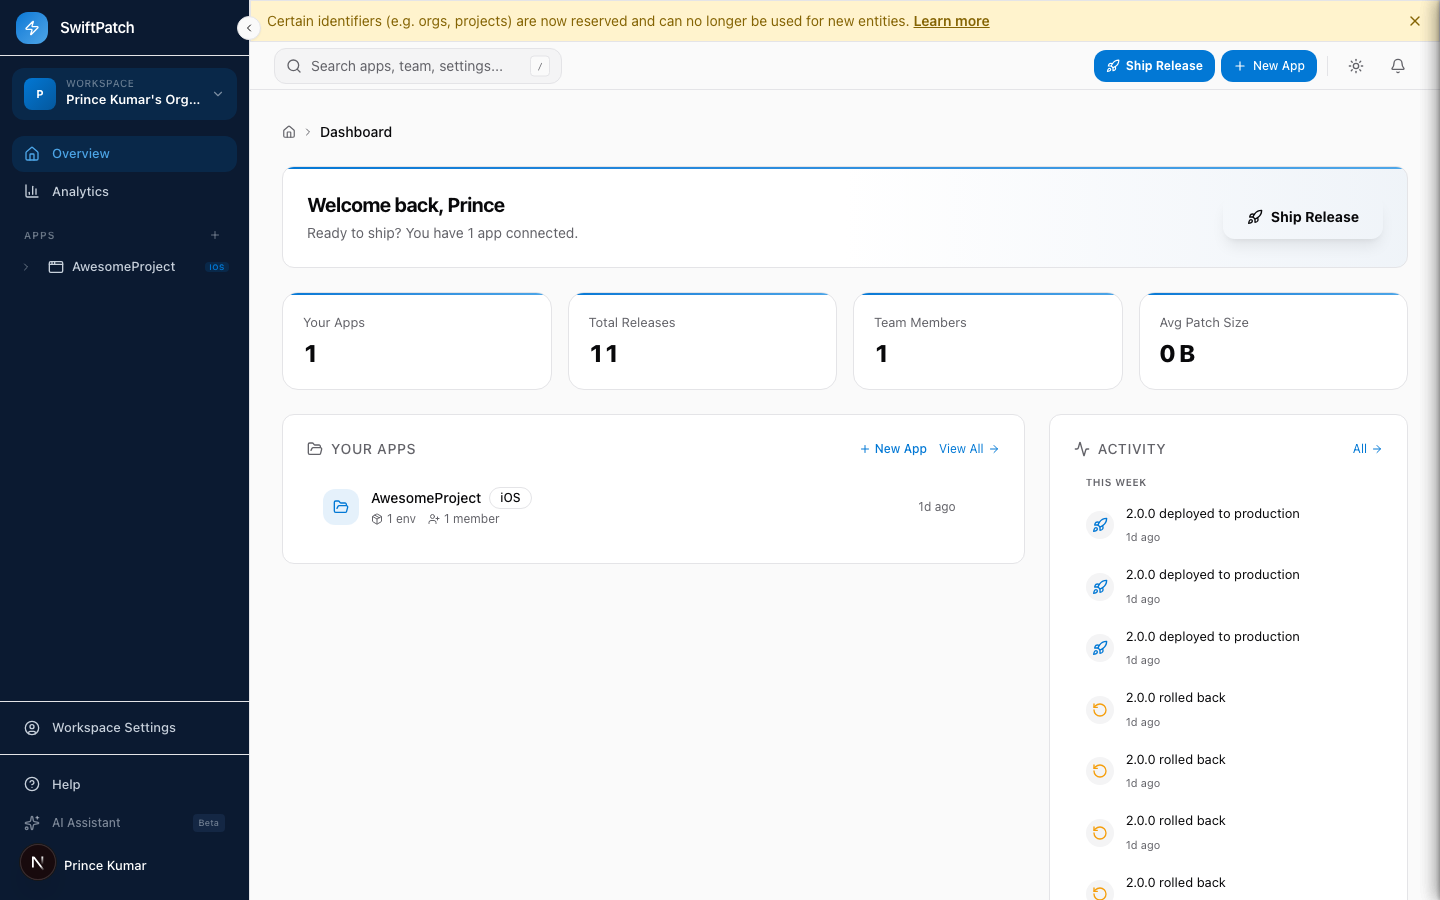
Your home screen gives you a quick snapshot of your workspace:
- Your Apps -- Total connected apps
- Total Releases -- OTA releases shipped across all apps
- Team Members -- People with workspace access
- Avg Patch Size -- Average bundle size
Below the stats, two panels keep you oriented:
| Panel | What it shows |
|---|---|
| Your Apps | Apps with platform badges, environment count, and member count |
| Activity | Recent events -- deployments, rollbacks, and status changes |
Sidebar Navigation
Workspace-level pages:
- Overview -- Home screen
- Analytics -- Metrics across all apps
App-level pages (expand any app):
- Releases -- All releases for that app
- Channels -- Channel-specific release history
- Members -- People with access
- Settings -- App configuration
The sidebar also links to Workspace Settings, Help, and the AI Assistant (Beta).
Press / from any page to open global search.
Apps
A searchable, sortable list of every app in your workspace. Switch between grid and list views.
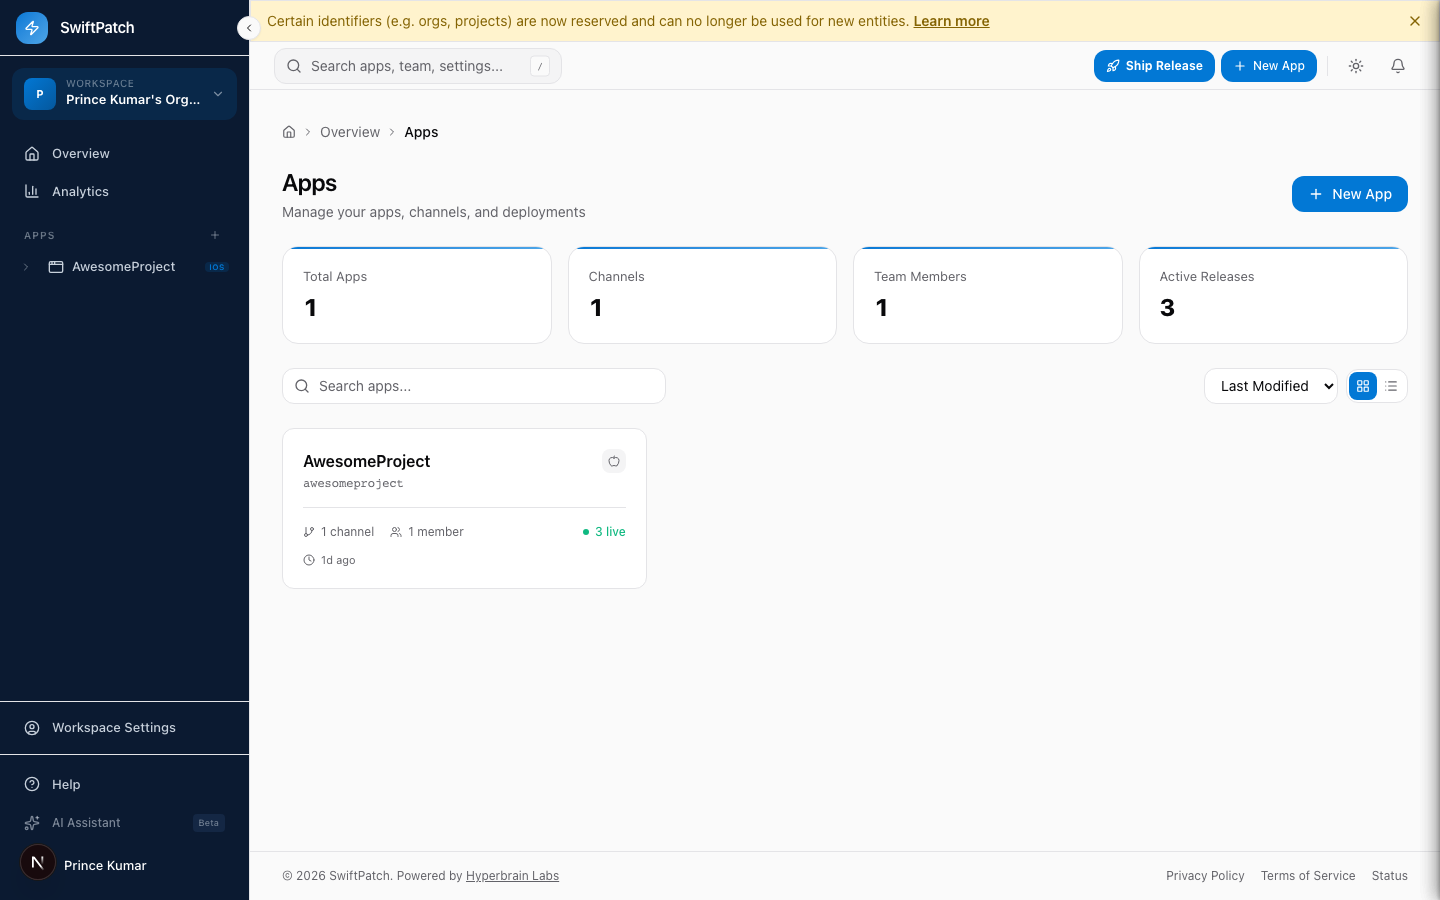
In older dashboard versions, apps were called "projects." Some screenshot filenames still reflect this.
See Apps for details.
App Detail View
Click any app to see its channels, live versions, members, and tokens.
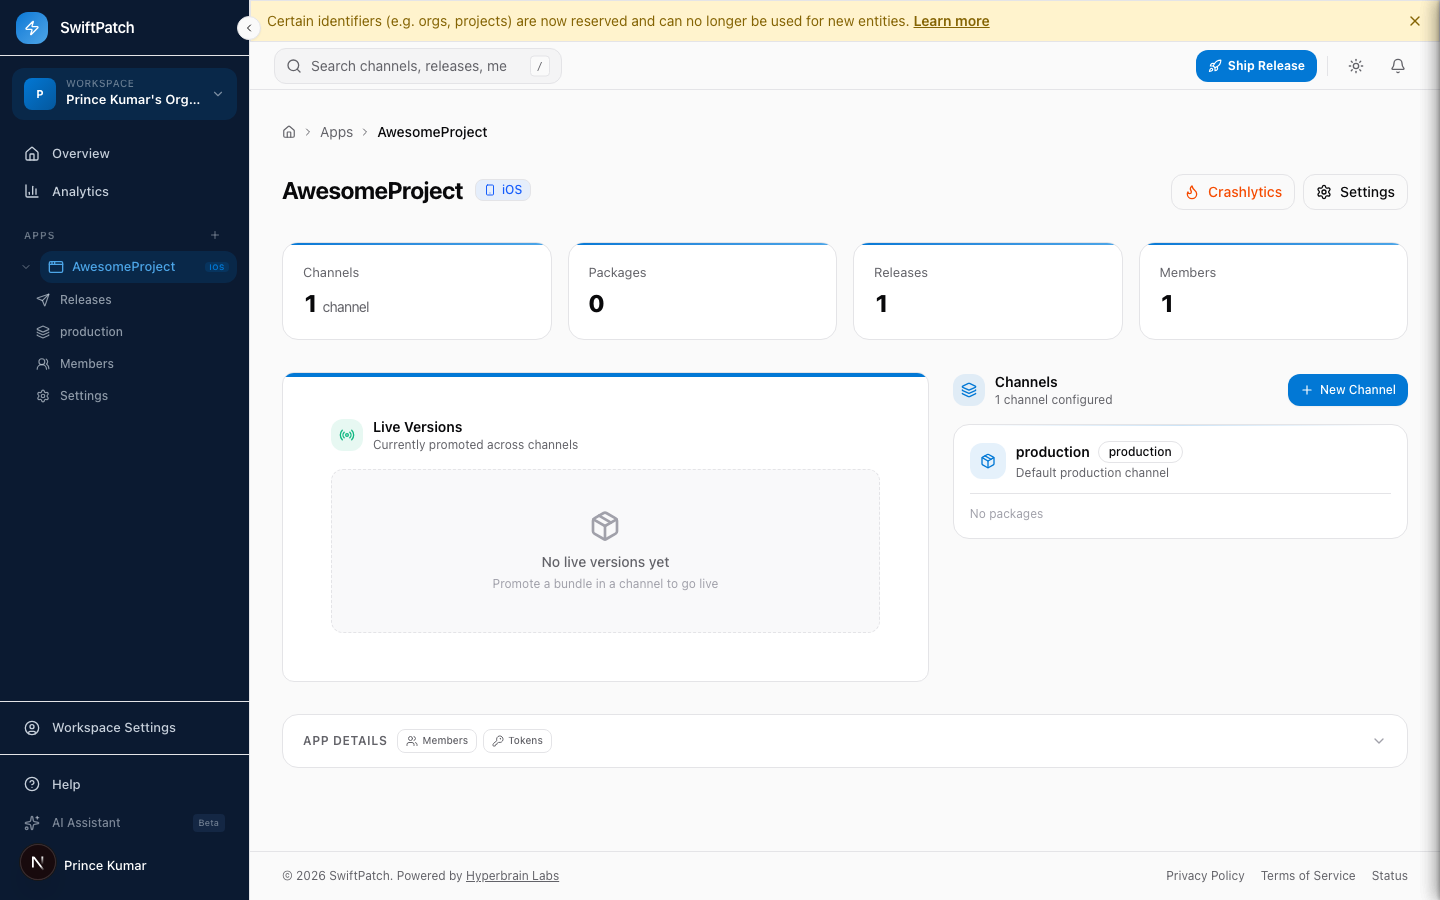
A channel is a deployment target (like production or staging). A release is a specific bundle shipped to a channel.
Releases
A table of every OTA update across your workspace:
| Column | Description |
|---|---|
| Release | Version, channel, platform, and description |
| Status | Live or Disabled |
| Rollout | Percentage of users receiving this release |
| Installs | Devices that installed the update |
| Success | Install success rate |
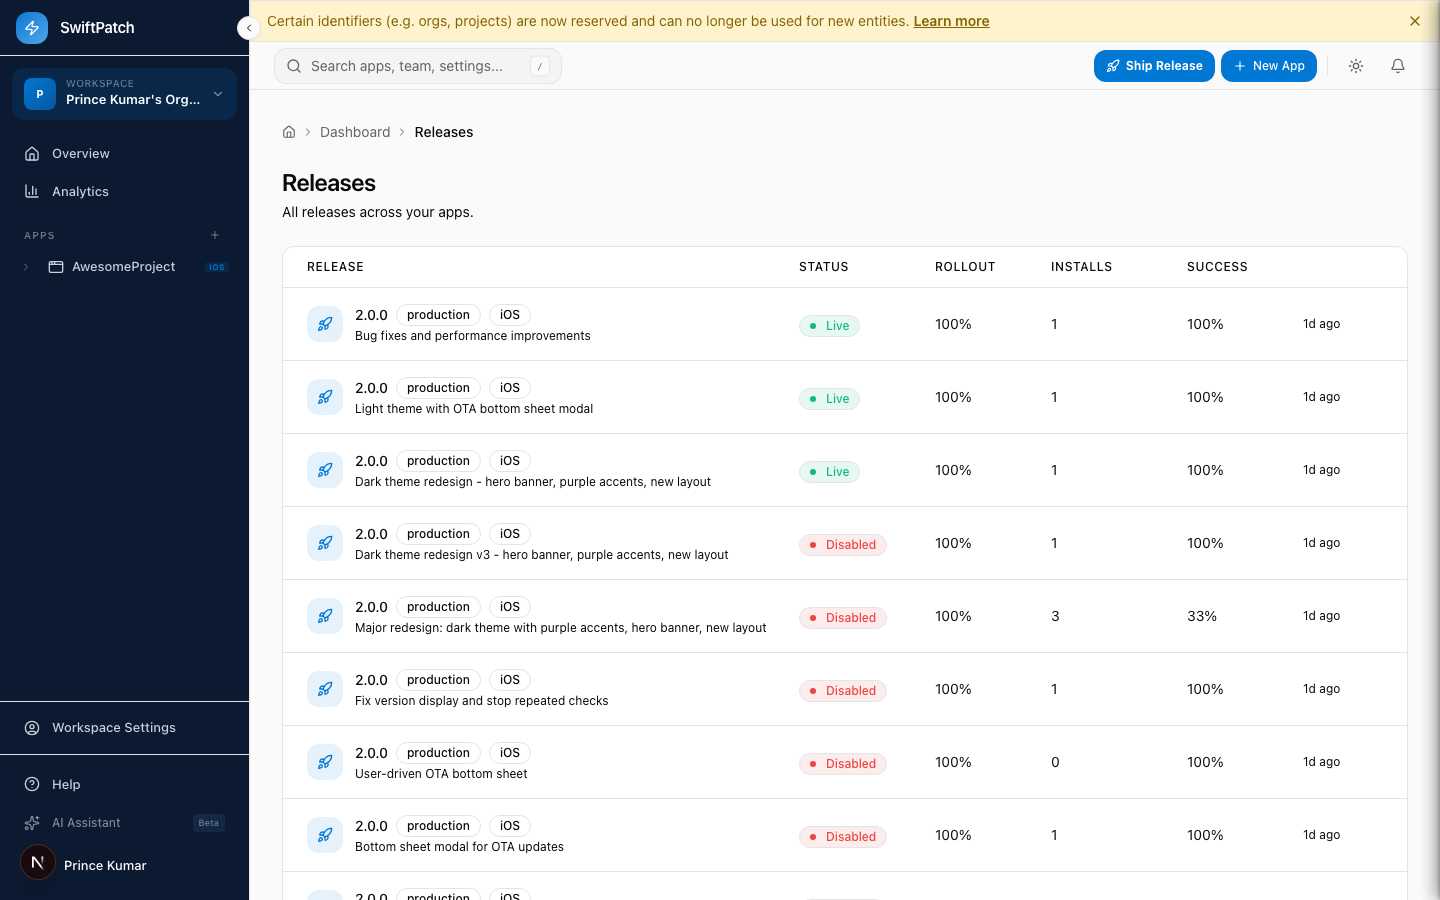
See Releases for details.
Analytics
Aggregated data across all apps. Filter by platform and time range.
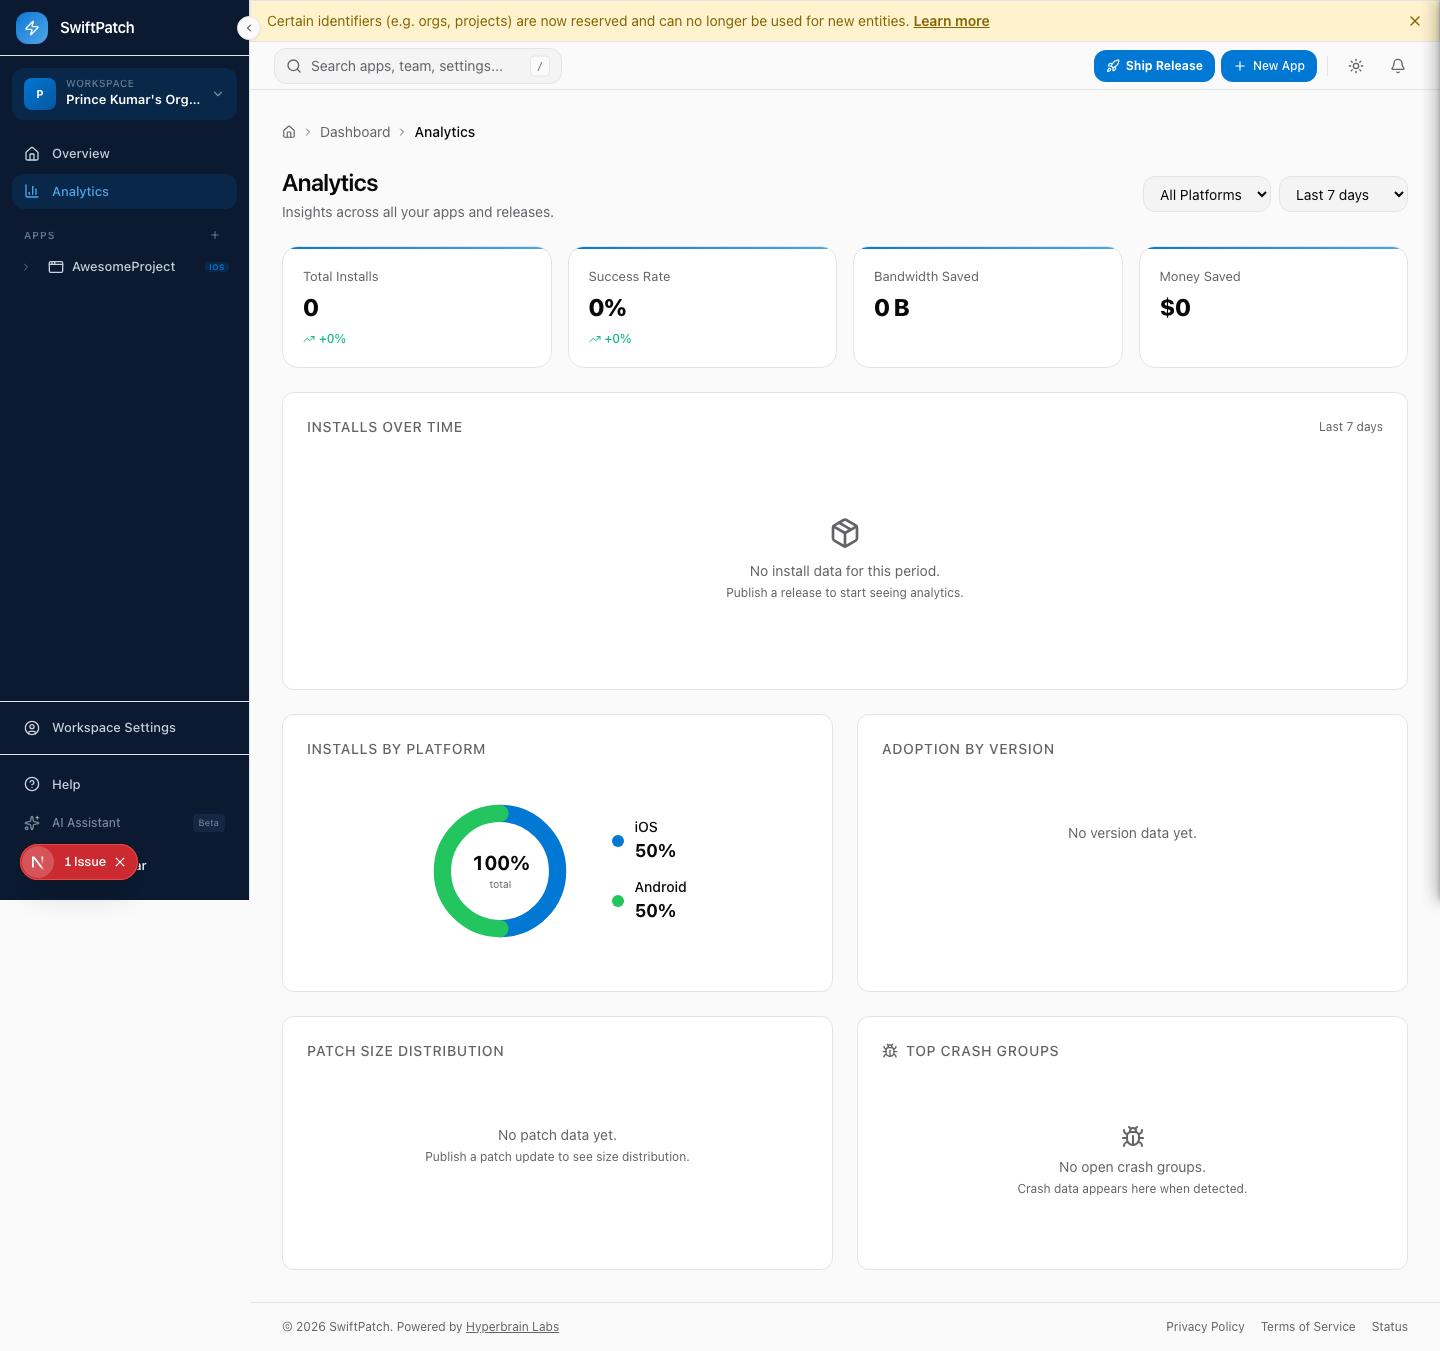
Here is what you will find:
- Summary cards -- Total Installs, Success Rate, Bandwidth Saved, Money Saved
- Installs Over Time -- Time-series chart
- Installs by Platform -- iOS vs. Android split
- Adoption by Version -- User adoption per release
- Patch Size Distribution -- Bundle size breakdown
- Top Crash Groups -- Most frequent crashes after updates
See Analytics for details.
Workspace Settings
Click Workspace Settings in the sidebar.
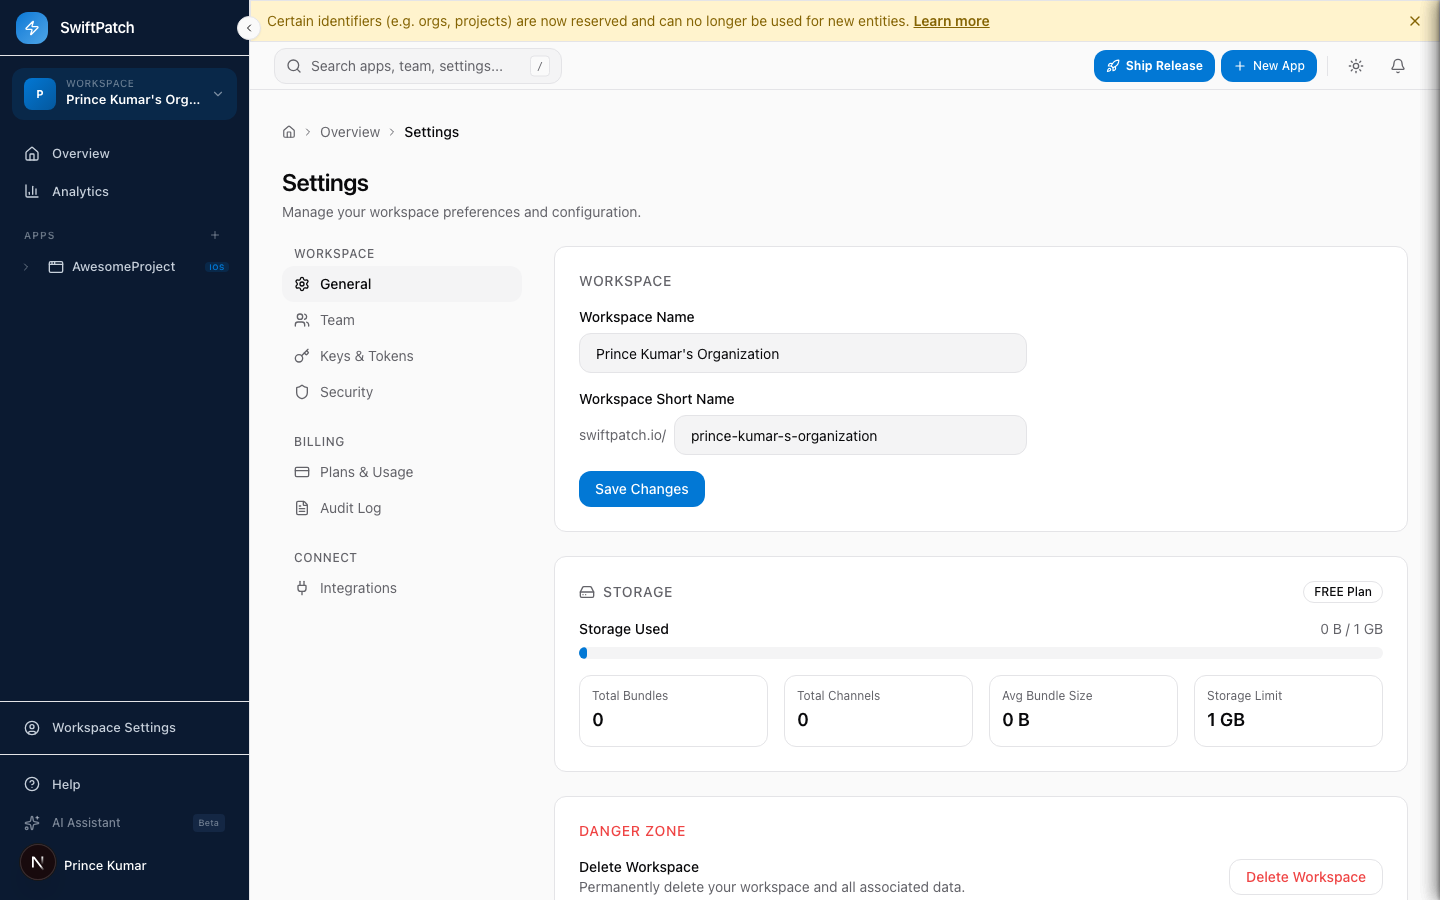
- Workspace -- General, Team, Keys & Tokens, Security
- Billing -- Plans & Usage, Audit Log
- Connect -- Integrations
Dark Mode
Toggle dark mode using the sun/moon icon in the top-right corner.