Analytics
The Analytics dashboard shows how your OTA updates are performing across all apps.
Click Analytics in the sidebar to open it.
Filtering
Use the dropdowns in the top-right corner:
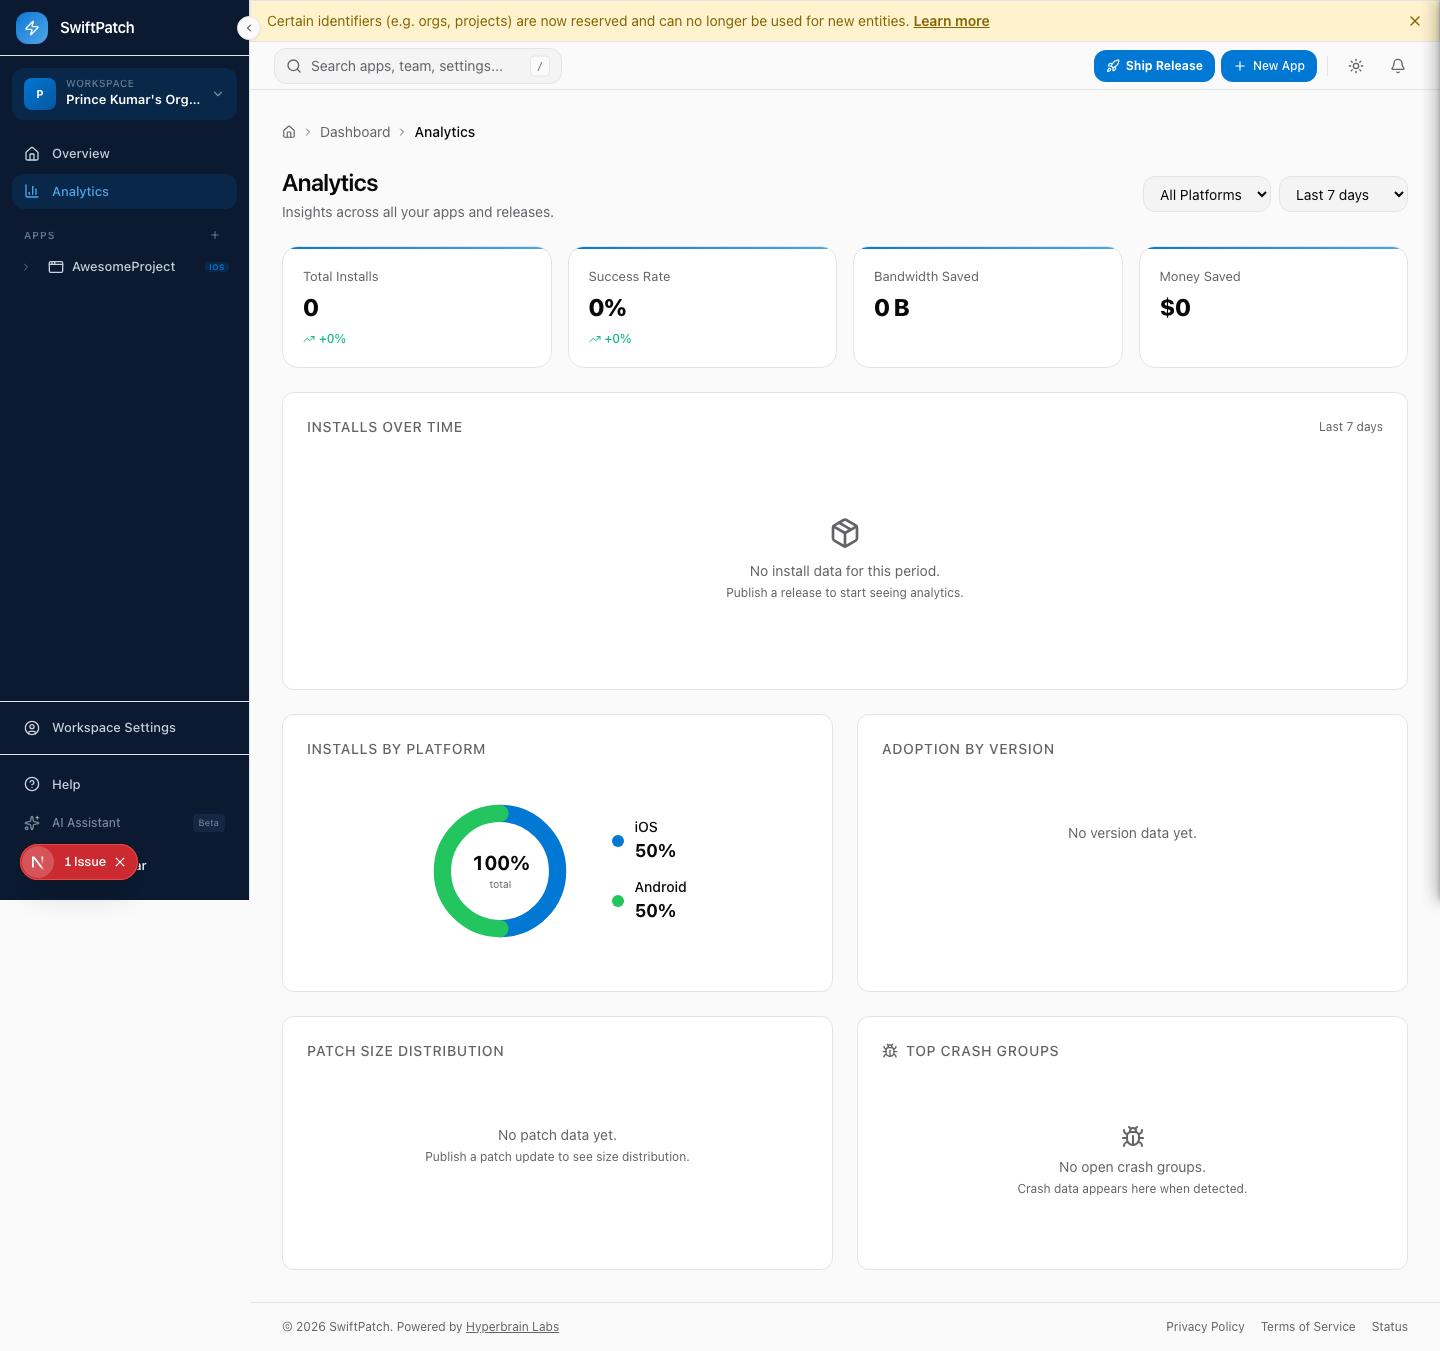
- Platform -- All Platforms, iOS, or Android
- Time range -- Last 7 days, Last 30 days, or custom
All cards and charts update instantly when you change a filter.
Summary Cards
Total Installs
How many times devices downloaded and applied an OTA update. A single device updating twice counts as two installs.
Success Rate
Percentage of update attempts that completed without error. A healthy rate is above 98%.
A sudden drop often means a mismatched target binary version. Verify that targetBinaryVersion matches what your users are running.
Bandwidth Saved
Data your users avoided downloading because SwiftPatch sends differential patches instead of full bundles.
Money Saved
Estimated savings based on standard CDN egress (data transfer from servers to user devices) pricing.
Charts
Installs Over Time
Daily install count as a time-series chart. Use it to spot adoption spikes, drops, and correlations with your release schedule.
Installs by Platform
iOS vs. Android split as a donut chart.
Adoption by Version
Which release versions your users are running. Helps you spot adoption stalls.
Patch Size Distribution
Size breakdown of your patches.
If sizes are growing, ship updates more frequently so each differential is smaller.
Crash Groups
The most impactful crashes after OTA updates. SwiftPatch uses AI-powered analysis to cluster related reports by error type and stack trace.

Filter by app, status (Open, Resolved, All), and severity.
SwiftPatch can automatically roll back when it detects a crash spike. Configure thresholds in your release settings.
Exporting Data
Step 1: Set your date range and platform filters.
Step 2: Click Export.
Step 3: Choose CSV.